
Top 10 States With the Best Tap Water
Posted by Travis Richards on Aug 11th 2026
2026 Rankings Based on EPA Drinking Water Compliance Data
What state has the best tap water? It sounds like a simple question… but it isn’t.
What about each state’s tap water makes it the “best tap water” and how do we measure it? Many different factors could include taste, mineral content, contaminant concentration, or regulatory compliance. Depending on what you are measuring, your results may vary.
For this 2026 ranking, we decided to go straight to the data gathered by the U.S. Environmental Protection Agency’s Safe Drinking Water Information System (SDWIS) and look at the health-based drinking water violations among Community Water Systems across all 50 states.
These results are based on which states had the strongest drinking water compliance performance based on the most recent complete calendar year (2025).
What Does “Best Tap Water” Mean?
There is no single measurement that determines whether one state has “Better” tap water than another. The quality of the water can vary between states, cities, utilities, and even individual homes. So, a statewide ranking cannot tell you exactly what is coming out of your faucet.
That’s why our ranking looks at regulatory compliance.
The EPA’s Safe Drinking Water Information System contains detailed information about public drinking water systems across the country, including things like system type, population served, drinking water violations, and enforcement history.
Our analysis focuses specifically on Community Water Systems (CWS). The EPA defines a Community Water System as a public water system that serves at least 15 service connections used by year-round residents or regularly serves at least 25 year-round residents.
To put that simply, these are the public water systems that supply homes, apartments, and other permanent residences.

How We Ranked the States
 To figure out which state has the best tap water for this 2026 ranking, we analyzed federal drinking water compliance data using the following criteria:
- Database: EPA Safe Drinking Water Information System (SDWIS)
- Water systems included: Community Water Systems (CWS)
- Geographic scope: All 50 U.S. states
- Analysis period: 2025 calendar year
- Systems counted: Community Water Systems operating during at least some portion of 2025
- Violations included: Health-based violations classified by EPA as Maximum Contaminant Level (MCL), Maximum Residual Disinfectant Level (MRDL), or Treatment Technique (TT) violations
- Primary ranking metric: Percentage of Community Water Systems with one or more health-based violations
- Secondary metric: Share of reported Community Water System service population associated with affected systems
- Why percentages instead of raw totals: States have very different numbers of public water systems, so comparing percentages provides a more useful state-to-state measure than simply counting violations
An MCL violation occurs when a regulated contaminant exceeds its allowable maximum level. An MRDL violation involves the maximum allowable concentration of a disinfectant. A Treatment Technique violation occurs when a water system fails to follow a required treatment process used to control a contaminant.
Population-served figures were used only as a secondary indicator. Because EPA reports population served at the individual system level, service populations can overlap between interconnected water systems. Those figures should therefore not be interpreted as a count of individual residents affected by a drinking water violation.
Based on those criteria for identify which state had the best tap water, these are the ones that rose to the top.
 1. Hawaii
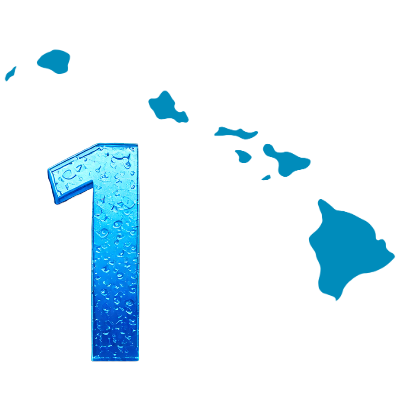
Community Water Systems with health-based violations: 0.84%
Hawaii takes the top position of our 2026 ranking. Out of its 119 CWS identified as operating during 2025, only one was associated with a qualifying health-based violation in our analysis. The system involved also served a relatively small population. This means that Hawaii performed exceptionally well under both our system-based and service-population measures.
Now, that doesn’t mean every faucet in Hawaii has identical water quality, but statewide regulatory compliance among its systems stood out from the rest of the country
 2. Iowa
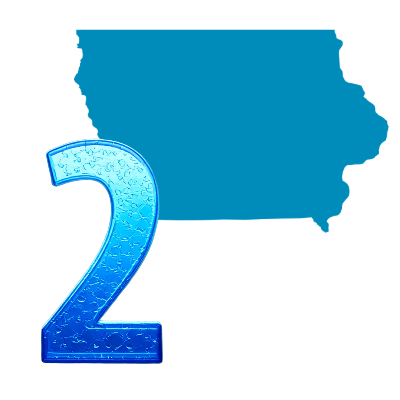
Community Water Systems with health-based violations: 1.11%
Iowa comes in second on our list with just 12 of the 1,084 CWS in our analysis associated with a health-based violation. It’s important to point out that Iowa has far more CWS than several other states near the top of this list. Despite having more than 1,000 systems included in the analysis, nearly 99% had no health-based violation in 2025.
 3. New York
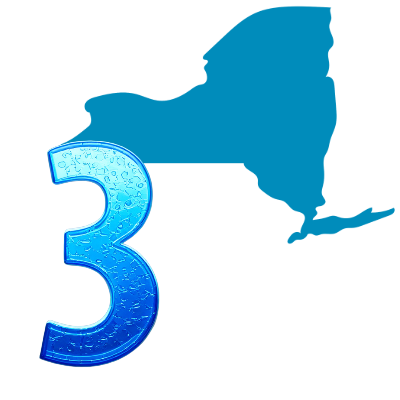
Community Water Systems with health-based violations: 1.97%
If this one came as a surprise to you, just know that we were equally surprised as well.
With a large population and a diverse network of public water systems, New York still had health-based violations associated with fewer than 2% of the CWS operating during the period we analyzed. It’s also a useful reminder of why raw violation counts don’t necessarily provide a fair comparison between states. States vary significantly in both population and the number of individual water systems, which is why raw violation counts don’t always provide a fair comparison.
This also further reinforces why it is so important to understand exactly what’s in your drinking water. Just because your state is on this list, doesn’t mean you should avoid checking out your water quality report. Just because New York is on this list, it doesn’t mean it’s free from drinking water concerns. It means that a relatively small percentage of its CWS had health-based violations in our 2025 analysis.
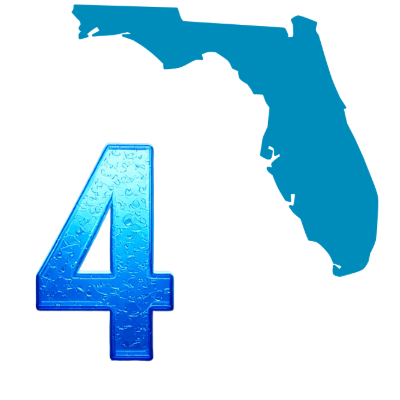 4. Florida
Community Water Systems with health-based violations: 2.29%
Based on the measures we examined, Florida performed particularly well. Only about 2.3% of its Community Water Systems were associated with a qualifying health-based violation, while the affected systems represented a relatively small share of the state's reported CWS service population.
So, regardless of whether the results are viewed from a system or service-population perspective, that puts Florida among the strongest performers on the list.
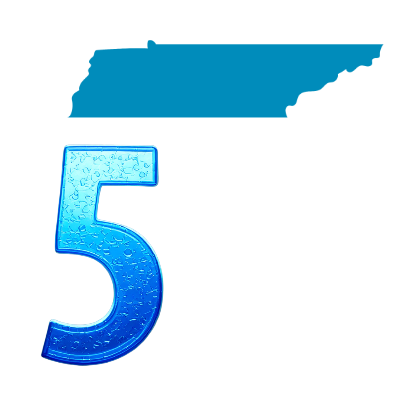 5. Tennessee
Community Water Systems with health-based violations: 2.41%
With fewer than 2.5% of its CWS associated with health-based violations, Tennessee rounds out the top five.
Just like with New York, Tennessee’s position is a good example of why it matters to normalize the data. Rather than rewarding states simply for having fewer water systems, the ranking looks at the proportion of systems experiencing qualifying violations.
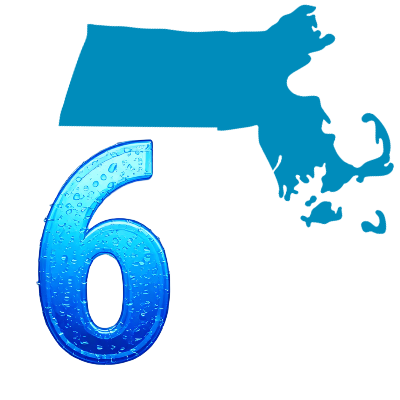 6. Massachusetts
Community Water Systems with health-based violations: 2.66%
Massachusetts performed consistently well across both of the major indicators we examined for this list. It’s important to point out that about 2.7% of it’s CWS were associated with health-based violations, while less than 1% of its reported CWS service population was associated with those affected systems.
That consistency makes Massachusetts one of the stronger all-around performers in this analysis.
 7. Georgia
Community Water Systems with health-based violations: 2.89%
Georgia takes the 7th spot on this list with fewer than 3% of its CWS experiencing a qualifying health-based violation in 2025. Because its service-population measure was somewhat higher than several states around it in the rankings, this shows an important limitation of looking only at the number of systems involved. One violation at a larger utility can potentially represent a much larger service area than several violations at small systems. That’s why it’s important to look at all the data to understand what the numbers actually represent.
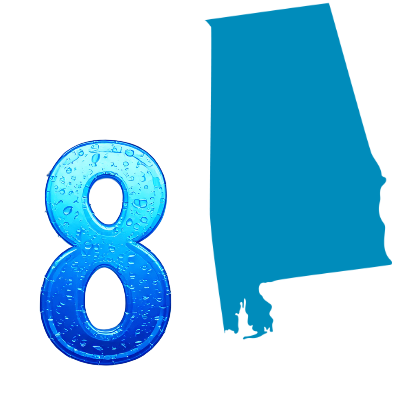 8. Alabama
Community Water Systems with health-based violations: 3.27%
At 8th on this list, roughly 97% of Alabama’s CWS had no health-based violation identified in 2025. Similar to Georgia, it’s service-population results weren’t quite as strong as its system-level performance. Still, the relatively small percentage of CWS associated with health-based violations put Alabama comfortably among the strongest performers nationwide.
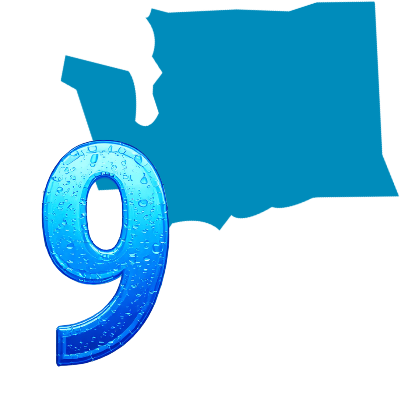 9. Washington
Community Water Systems with health-based violations: 3.32%
When we consider scale, Washington’s performance is intriguing. More than 2,400 CWS were included in this analysis, yet only about 3.3% were associated with a health-based violation.
Washington also performed very well by our secondary service-population measure, with affected systems representing less than 0.5% of its reported CWS service population.
That makes Washington one of the most consistently strong performers across both measures.
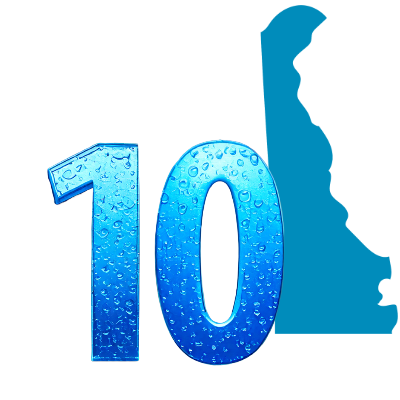 10. Delaware
Community Water Systems with health-based violations: 3.42%
Delaware completes our Top 10 list. Its percentage of affected CWS is slightly higher than Washington’s, but Delaware performed exceptionally well when the size of those systems is considered. The affected systems represented only around 0.15% of the state’s reported CWS service population.
In fact, by that secondary measure alone, Delaware ranked second in the country behind Hawaii.
Does a Top Ranking Mean a State Has Perfect Tap Water?
No, and this distinction is important.
In our rankings, to figure out which states had the best tap water, we measured reported regulatory compliance among Community Water Systems. There’s a lot more that goes into water quality, and this doesn’t cover every characteristic that determines water quality at each individual faucet.
EPA’s SDWIS allows consumers to review their tap water supplier and its violation and enforcement history reported under the Safe Drinking Water Act. But, statewide, those numbers can’t account for everything that happens between the water treatment facility and your glass.
Water quality can vary between utilities within the same state, and it can even vary between faucets in your neighborhood. Things like building age and plumbing materials used in your home, and even the maintenance of the water lines in your neighborhood can affect the water quality by the time it reaches your household.
And every violation needs context.
A health-based violation doesn’t automatically mean that every person served by that utility drank unsafe water. And on the flip side, the absence of a reported violation doesn’t mean absolutely nothing was present in the water either. EPA notes that health-based violations can involve exceeding an MCL or failing to follow required treatment processes, while monitoring and reporting violations are categorized separately.
That’s why it’s important to understand that these rankings are best used as a comparison of public drinking water regulatory performance, not a guarantee about the contents of any individual glass of water.
How Can You Find Out What’s in Your Tap Water?
 This state ranking can provide some interesting context, but your local water system tells you much more about the water in your home.
As required by the SDWA, Community Water Systems must provide a Consumer Confidence Report containing information about the source, detected regulated contaminants, and regulatory compliance for your drinking water. You can even search your public water system directly through the EPA’s SDWIS Federal Reporting Services to review information about that system and any reported violations it may have.
These records, along with your local Consumer Confidence Report, provide a much more useful picture of your drinking water than "best tap water" ranking alone. And in case you are considering any additional water treatment at home, that data can help you make informed decisions about what’s actually relevant to your water, rather than assumptions about whether your state has “good” or “bad” tap water.
And if you are interested in taking control of the water quality in your own home so you can be confident in your drinking water, we may have a solution for you.
The Best Tap Water Starts With Understanding the Data
Even though we’ve listed the top ten states with the best tap water, it’s important to note that there’s no perfect way to crown one state as having America’s best tap water (sorry Hawaii).
Taste is subjective.
Water chemistry varies.
Different ranking methodologies measure different things.
And that’s why we chose a specific question we could answer based on quantifiable information that was available:
Which states had the smallest share of Community Water Systems associated with health-based drinking water violations during 2025?
And under that definition, Hawaii came out on top as the state with the "best tap water." But the more important takeaway isn’t whether your state made the top 10.
In the United States, public drinking water is highly regulated and routinely monitored, and enormous amounts of information about that water are publicly available. So, instead of relying on a state’s reputation, city’s reputation, a viral headline, word of mouth, or even a national ranking like this one, look at the data for the water system serving your home.
When it comes to understanding what’s in your water, local data will almost always tell you more than your state’s ranking.
Because the data don’t lie.
FAQs
Which state has the best tap water in 2026?
Which states have the best tap water in the United States?
How is tap water quality measured?
Does having no drinking water violations mean my tap water is contaminant-free?
How can I check the quality of my own tap water?