
What’s in Your Water: How to Read the Water Quality Report
Posted by Kenton Jones on Mar 16th 2020
As we continue our March 2020 Spotlight, “Harmful Contaminants in Drinking Water,” it is important to discuss how consumers can find out what contaminants are in their local drinking water. To that end, this article will cover How to Read the Water Quality Report.
By law, every municipal water system in America is required to publish a freely available Consumer Confidence Report (CCR) that discloses the results of local water supply tests. This is what is commonly referred to as a “Water Quality Report.” While this is provided annually to households that pay a municipal water bill, for others – e.g., people who live in apartments or rent their homes – this is a report that must be specifically requested from the apartment owner, homeowner, municipal office, or found online.
Understanding your Water Quality Report is important, because if you know what types of contaminants can be found in elevated levels in your local drinking water supply, then you know if you need a drinking water system with specific capabilities, such as Multipure’s Aquaperform for its Arsenic-V reduction, or Multipure’s Aqualuxe with its bacteria and virus purification.
It is important to note that the information in your CCR is not fixed. Contaminant levels change over time, and safe contaminant ranges are adjusted as more studies are performed. This is why it’s a good idea to check your CCR each year as they are updated.
Regardless of your municipality, each CCR will include the following information:
- Water source, such as aquifers, lakes, rivers, wells, etc.
- Contaminants detected and their levels
- Potential health effects from consuming contaminated water
- Contaminant levels in your local water compared to national standards, as well as any alerts or violations of health-based standards
Your CCR primarily consists of a chart listing contaminants and their details, with some important terminology:
- Unit – The measurement of the specified contaminants, e.g. ppb, ppm, pCi/L, etc.
- ppb – Part per billion: A unit used to describe the presence of a contaminant in a system.
- ppm – Part per million: A unit used to describe the presence of a contaminant in a system.
- pCi/L – Picocuries per liter: A measure of radioactivity in water. The average indoor level is 1.3 pCi/L, and the average outdoor level is 0.4 pCi/L. Levels above 2 pCi/L are notable, and levels above 4 pCi/L are considered hazardous.
- MCL – Maximum Contaminant Level: The maximum allowable presence of a contaminant before the water system is in violation of EPA regulations. Values less than or equal to this denote safe water.
- MCLG – Maximum Contaminant Level Goal (MCLG): The ideal maximum presence of a contaminant in the water system. Values less than or equal to this denote safe water.
- MRDL – Maximum Residual Disinfectant Level: The maximum allowable presence of a disinfectant in the water system in order to treat microbial contaminants (e.g., bacteria, parasites, etc.).
- MRDLG – Maximum Residual Disinfection Level Goal: The ideal maximum presence of a disinfectant in the water system.
- TT – Treatment Technique: The required process used to reduce the level of a contaminant in the water system.
- Action Level – Signifies that the MCL for a contaminant requires that action is taken to treat the presence of that contaminant in the water system when it reaches or exceeds the MCL value.
Sample CCR portion for the Las Vegas Valley Water District Distribution System: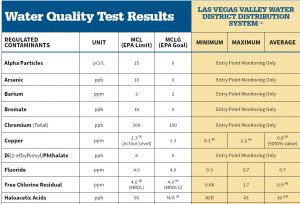
- Based on this example, several contaminants are monitored but remain unmeasured, marked as “Entry Point Monitoring Only.” These contaminants may not be specifically measured at this water system, but are measured instead at another source, such as groundwater wells.
- The level of Copper in the water system should remain below 1.3 parts per million. For Las Vegas, the measured values range from 0.1 ppm to 1.2 ppm, with an average reading of 0.8 ppm, well within safe water parameters.
- Fluoride, Free Chlorine Residual, and Haloacetic Acids also fall within safe levels.
Accompanying the data chart is a column explaining the likely causes of the presence of these contaminants (this chart is ordered by the same contaminants as the previous example):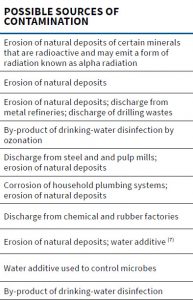
- Based on this data, Copper contamination is likely caused by the corrosion of household plumbing systems or the erosion of natural deposits.
- Free Chlorine Residual is due to the purposeful use of chlorine as a disinfectant to treat the presence of microbes in the water.
- The presence of Haloacetic Acids is a direct result of the use of chlorine, as it is a disinfection byproduct.
Given the data and examples above, you should now be able to gain insight into the quality of your own local water supply. To find your local CCR, please visit https://ofmpub.epa.gov/apex/safewater/f?p=136:102::::::
To learn about the specific health effects of different types of contaminants, please visit https://www.multipure.com/content/contaminants-health-effects.pdf.
For additional information, you can contact the EPA Safe Water Hotline at 1.800.426.4791. This can help you learn more about your CCR, help you locate your local water company, or give you information about more water information resources.